The Bridge Project

Launched in June 2021, The Bridge Project serves low-income mothers and their babies in New York City as well as Rochester and Buffalo. In 2024, The Bridge Project will expand to other states.

1,200

participants

Up to $1,000 a month

monthly payment

3 Years

duration

$30,000,000

invested in community

logo
Program Features  
Number of Participants1,200 individuals
AmountUp to $1,000 a month
FrequencyEvery two weeks
Program DatesJune 2021-ongoing
EligibilityThe Bridge Project’s eligibility varies depending on location, but targets low-income pregnant individuals. No SSN or ITIN is required.

About The Bridge Project

The Bridge Project is New York City’s first guaranteed income program. Launched in June 2021, The Bridge Project is designed to support low-income mothers in the United States during the first 1,000 days of their children’s lives by providing them with up to $1,000 monthly in consistent, unconditional cash. The Bridge Project currently serves more than one thousand mothers across several cohorts in every borough of New York City, as well as Rochester and Buffalo. In 2024, The Bridge Project will expand to other states. Since launching, the project has moved from a pilot to program approach. Policy efforts include advancing the Mothers and Infants Lasting Change (MILC) Allowance in New York, which would offer 15,000 mothers across the state cash payments for the first years of their baby’s life. *The demographic and spending data on this page is based on the initial 100 mothers in the first phase of The Bridge Project.

Data last updated on 7/11/2024.

Share Via

Demographic Data for Study Participants

Median Annual Household income

The Bridge Project

$12,654

New York City, NY

$74,694

Annual Household Income (Mean)

$14,520

Sample Size

100

Avg. Age of Respondent

29

Avg. Children in Household

2

Avg. Household Size

3

gender

Male

0%

Female

100%

Other

0%

marital status

Married

23%

Single

52%

Partnered/In-Relationship

25%

children in household

Yes

75%

No

25%

race

White

20%

African American

39%

American Indian/Alaska Native

0%

Asian

0%

Native Hawaiian/Pacific Islander

0%

Latino

N/A%

Other/Mixed

41%

ethnicity

Hispanic

74%

Non-Hispanic

26%

primary language at home

English

64%

Spanish

34%

Other

2%

Economic Context for Pilot Participants

The guaranteed income pilot launched during a period of dynamic change and economic challenges for pilot participants. The chart below situates this pilot in the context of unemployment and inflation.

Start of Covid-19 PandemicJan 2019MarMayJulSepNovJan 2020MarMayJulSepNovJan 2021MarMayJulSepNovJan 2022MarMayJulSepNovJan 2023MarMayJulSepNovJan 2024MarMayJulSepNovJan 2025MarMayJulSepNovJan 202602468101214161820Unemployment02468101214161820Inflation
Unemployment  
Inflation  
Pilot Timeline
;

Spending Breakdown

The data in this pie chart shows aggregate spending for guaranteed income participants in New York City, NY. This includes all non-cash expenditures from the participants' pre-paid debit card that is loaded with guaranteed income payments every two weeks.

Spending breakdown

Retail sales and services accounted for the largest share of spending, at 40.69%, followed by Food and groceries (36.21%) and Housing & Utilities (9.98%).

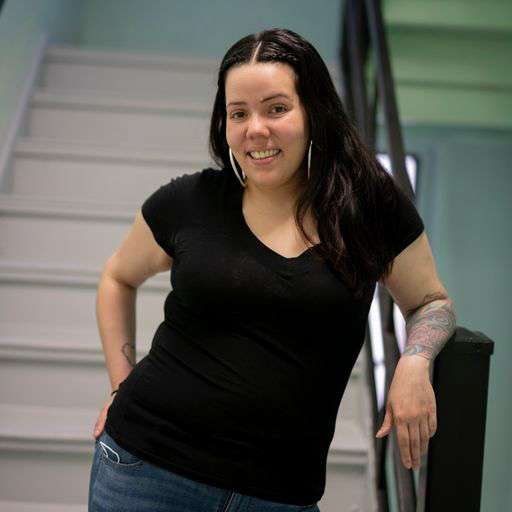
Christina

“It’s a relief that I feel – everything that I went through and all of the struggles – and then The Bridge Project came along. I swear, if it wasn’t for The Bridge Project – I don’t know where I would be mentally, physically, etc."

Christina

The Bridge Project

New York City, NY

Sign up for our newsletter